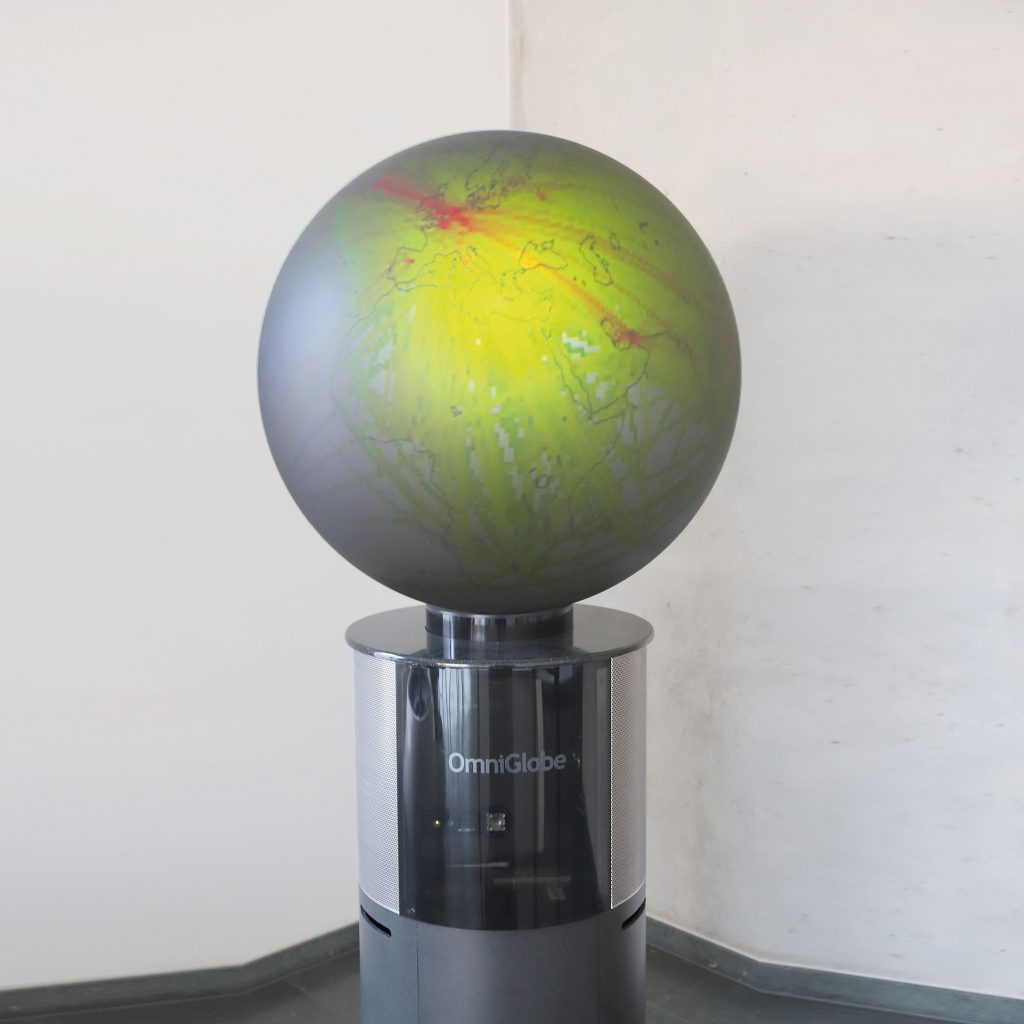
Visualising global flight paths on a spherical display
The exhibit shows global flight paths and emission distributions on a spherical display. Typically, geo-reference data like this is transposed onto a two dimensional map using cartographic projections. This is always associated with some level of distortion that makes interpreting the results more diffcult. Using a spherical projection, information can be mapped onto a spherical surface thus allowing size ratios, distances and angles to be accurately compared.
The results from three different areas of interest are shown:
Climate-optimised flight routes: The concept of climate-optimised flying is based on the idea of flying around regions where there would be a particularly severe effect on the environment and avoiding the formation of contrails and emission of substances (ozone) that are harmful to the environment. The globe shows flight routes over the North Atlantic and in Europe that would signifcantly reduce climate impact.
Formation flight routes: Flying in formation in a similar fashion to migratory birds allows for a signifcant reduction in air drag. This in turn leads to increased fuel effciency and reduced climate impact. A number of challenges must frst be addressed for use in civil aviation. The exhibit shows the places where effcient formation flights could be operated across the globe based on real flight schedules and which airports would be particularly affected.
Distribution of global emissions: Aviation generates greenhouse gas emissions that have a particularly severe effect on the climate due to the typical altitude at which aircraft operate. In order to quantify this effect, atmospheric researchers use emission inventories that contain the global distribution of the individual type of emission. The globe shows, among others, surveys of nitrogen oxide emissions that also contain future projections of how the levels will change up to the year 2050.
German Aerospace Center (DLR)
Florian Linke · E-Mail: florian.linke@dlr.de · DLR.de/en
